Data presentation and discussion
Weathering of the different wood species
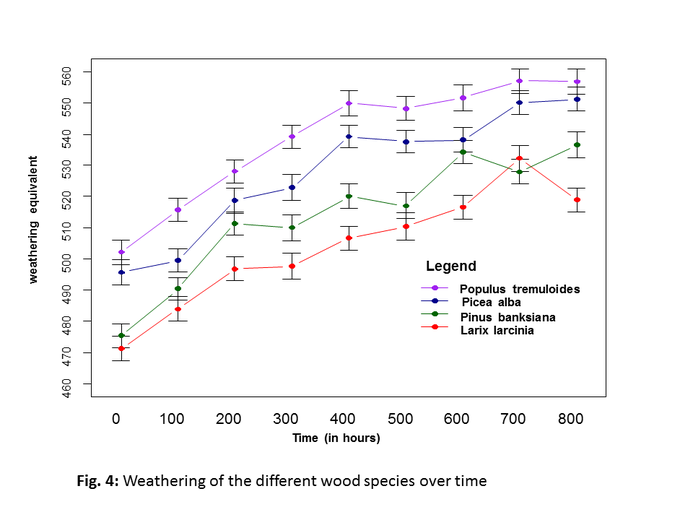
The line plot (Fig. 4) shows the weathering process of the four different wood species over time.
The y-axis shows the weathering equivalent and is labeled from 460 to 560 in 20s interval steps. The x-axis shows the different time measurement steps from 0 to 800 hours. The four species are different colored.
The line plot shows in general that the weathering or bleaching over time is rising, so every wood species is bleaching over time. All the lines of the species have a similar trend. The part from 0 to 300/400 is steeper. After that point the gradient has a flattening course, which means the bleaching process decrease. Attention points are the steep increasing gradient of Larix larcinia between 600 to 700 hours and the following drop between 700 to 800 hours. One explanation, especially for Larix could be a decomposition of some components like Lignin. To characterize the composition of the surface we will do further tests like Scannining electron microscopy (SEM) and Fourier transform infrared spectroscopy (FTIR) (Stark &Matuana 2007). On the other hand, the error bars show the high deviation, which also could be an explanation for the changes.
Weathering on the different treatment
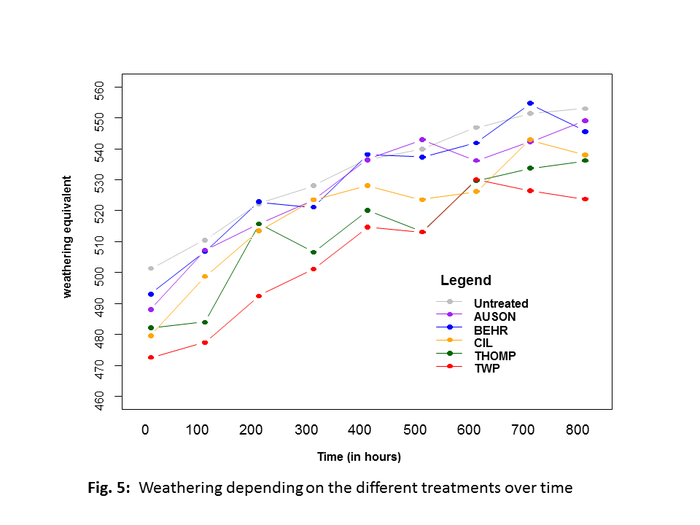
Similar to the line plot above, this graph shows the weathering comparison of the different treatments over the time of 800 hours in 100 hour steps (Fig. 5). There are a few smaller movements and overlapping in the treatment lines. To make the graph not too confusing and easier understandable the error bars are turned off. A detectable trend over time for all of the treatments is a steeper gradient during the first sector of 400 hours. After that most of the lines going flatter, except THOMP and TWP. During the last 100 hours even three of the treatments (BEHR, CIL, TWP) have a decreasing course. A explanation could be the decomposition of the treatments after that time. The untreated control sample has most of the time the highest weathering equivalent, excluding a few overlapping with AUSON and BEHR.
Statistical Analysis
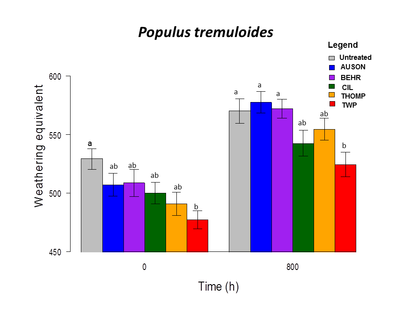
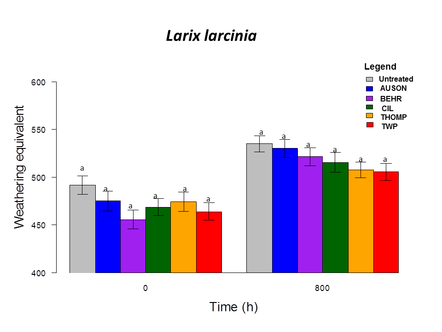
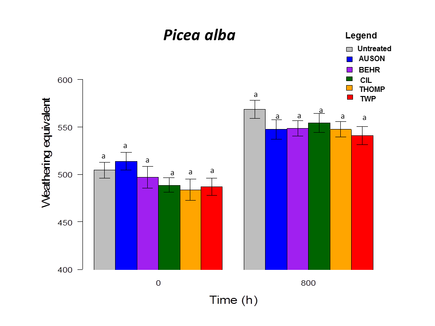
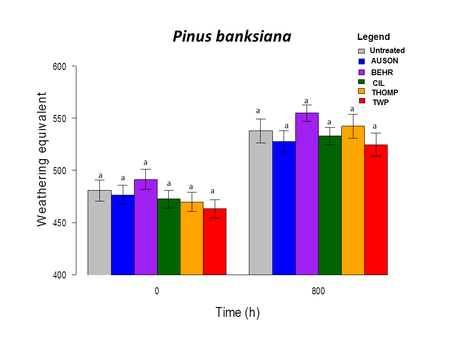
For the statistical Analysis I used an ANOVA parametric test, basically because we have more than 2 means to compare. I also tried an ANACOVA, blocking the Replication and Location variables as a random effect with comparable results. The results of the ANOVA are presented by the letters above the following bar plot graphs. The same letter (e.g. a and a) above the plots show, that there is no significant difference to each other, while different letters implied a significant difference based on the ANOVA. I used the analysis of variances to compare the significant difference of the weathering effect between the different wood species (Fig. 6) and the different treatments (Fig. 7) at the beginning (time 0 hours) and the end (time 800 hours). The labels above the bar graphs in Fig. 8 show the results of the ANOVA for the different treatment by wood species.
For the statistical Analysis I used an ANOVA parametric test, basically because we have more than 2 means to compare. I also tried an ANACOVA, blocking the Replication and Location variables as a random effect with comparable results. The results of the ANOVA are presented by the letters above the following bar plot graphs. The same letter (e.g. a and a) above the plots show, that there is no significant difference to each other, while different letters implied a significant difference based on the ANOVA. I used the analysis of variances to compare the significant difference of the weathering effect between the different wood species (Fig. 6) and the different treatments (Fig. 7) at the beginning (time 0 hours) and the end (time 800 hours). The labels above the bar graphs in Fig. 8 show the results of the ANOVA for the different treatment by wood species.
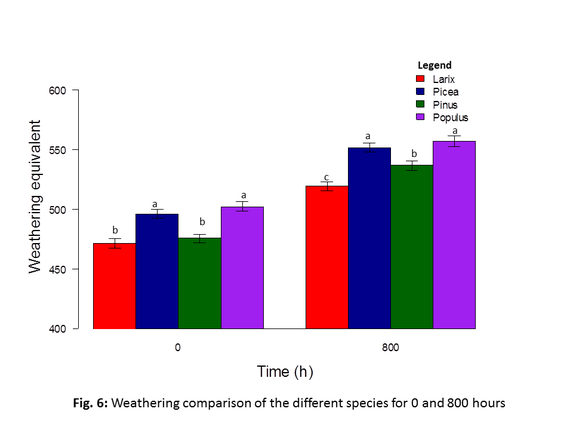
The following bar plots are more focused on the weathering equivalent comparison between the beginning (time 0 hours) and the end (time 800 hours) of the weathering process. The letters above the Error bars show the results of the ANOVA (c.f. Statistical Analysis above).
Fig. 6 shows the comparison between the wood species. At the beginning of the weathering process Larix and Pinus with a weathering equivalent of around 470 have no significant difference between each other (both letter b), but they have a lower weathering equivalent compared to Picea and Populus (weathering equivalent 500), which also aren’t significant different to each other (both letter a). After the weathering process (800 hours) Larix shows a significant difference to Pinus, while Picea and Poplus still not point a significant difference, but have still the highest weathering equivalent around 550.
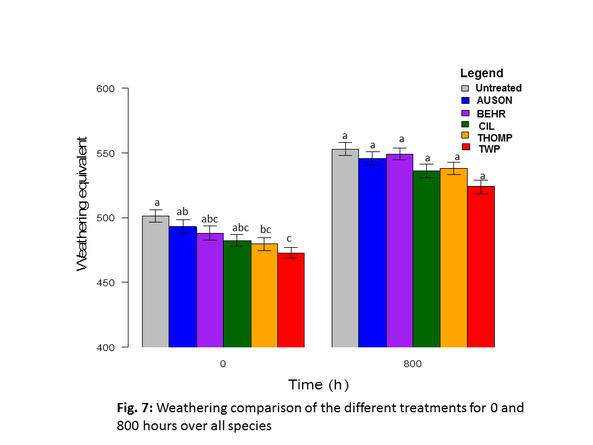
Fig. 7 presents the comparison between the different treatments.
The weathering equivalent at the beginning of the weathering is between 480 and 500 and after 800 hours between 530 and 550. In descending order the weathering equivalent for the treatments is decreasing from Untreated>AUSON>BEHR>CIL>THOMP>TWP for with small order changes between AUSON and BEHR and CIL and THOMP for the 800 hours. At the beginning the plots show a significant difference, especially between the untreated measurements (letter a) and the treatments THOMP and TWP (letter c). At the end of the weathering process the ANOVA doesn't indicate any significant difference between the treatments (all letter a).
Fig. 8 illustrates the weathering of the different treatments by wood species. Except the results of Populus tremuloides the ANOVA indicates no significant difference neither for time 0 hours nor time 800 hours for Larix larcinia, Picea alba and Pinus banksiana. There are some smaller order changes identifiable but non of them is significant or special for one of the species. The only significance effect is detectable between the untreated sample and the treatment TWP for Populus tremuloides for both measurement times.
|
|
|
|
Fig. 8: Weathering of the different treatments by wood species
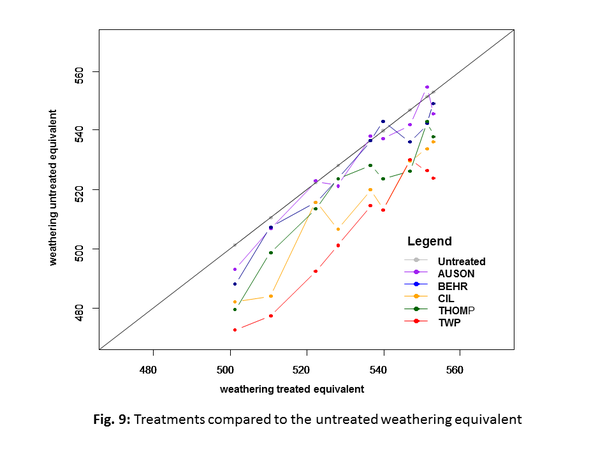
Fig. 9: is comparable with the line plot (Fig. 6) but with a direct focus on the comparison of the untreated (control) sample, presented as a grey abline, compared to the other coatings. While the treatments AUSON and BEHR are close to the abline and showing overlapping, TWP is far away from the abline but considering the ANOVA results they are all not significant different from the the untreated sample, especially after the the 800 hours.
First idea creating this graphic, was also to compare the results of the accelerated weathering to an equivalent to natural weathering in weathering hours compared to years, but a literature research shows that laboratory and natural are not comparable at all, because of a lot other natural influencing factors, like different UV radiation, seasons, latitudes, radiation angle etc. (Deflorian et al. 2007).
First idea creating this graphic, was also to compare the results of the accelerated weathering to an equivalent to natural weathering in weathering hours compared to years, but a literature research shows that laboratory and natural are not comparable at all, because of a lot other natural influencing factors, like different UV radiation, seasons, latitudes, radiation angle etc. (Deflorian et al. 2007).
